PollyXT
Automatically uploaded on 2014-06-25 06:48:03.
| Start time | June 18, 2014, 1:34 p.m. |
| Stop time | June 18, 2014, 7:34 p.m. |
| Duration | 6 hours |
| Instrument | PollyXT lidar |
Related graphs
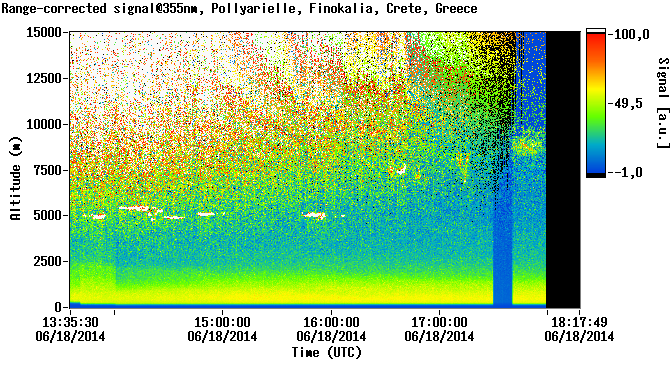
Graph 1: Range-corrected signal@355nm - 2014_06_18_Wednesday_13_34_19-355.png
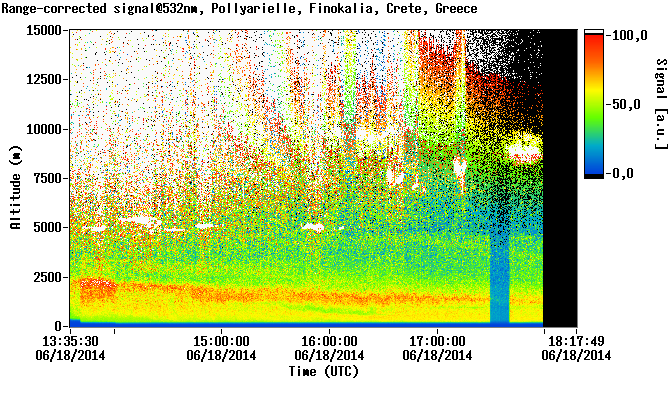
Graph 2: Range-corrected signal@532nm - 2014_06_18_Wednesday_13_34_19-532.png
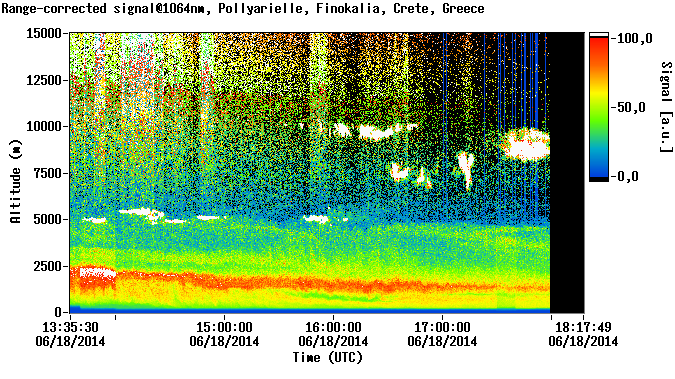
Graph 3: Range-corrected signal@1064nm - 2014_06_18_Wednesday_13_34_19-1064.png
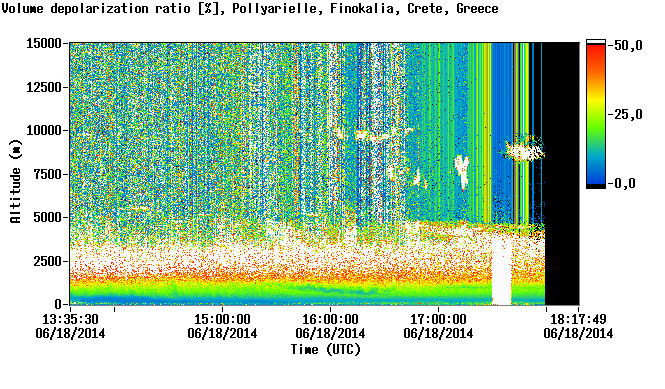
Graph 4: Volume depolarization ratio - 2014_06_18_Wednesday_13_34_19-depol.png
Recent activity
News
- ITaRS participation in CHARADMExp (Jul 10th)
- UAV measurements (video) (Jul 1st)
- Cyprus Institute UAVs are heading to Sitia's airport (Jun 26th)
- Saharan dust is approaching (Jun 24th)
- Getting prepared for UAV flights over Crete (Jun 23rd)
Uploaded data
- HALO realtime (Sep 9th)
- FLEXPART (Jul 31st)
- WRF WIND (Jul 31st)
- WRF WIND (Jul 31st)
- WRF WIND (Jul 31st)
CHARADMexp campaign is funded by the European Space Agency.
CHARADMexp is supported by the BEYOND Centre of Excellence, in the frame of the satellite cal/val activities performed by the Centre. LIVAS climatology as well as the smoke dispersion and dust services provided by BEYOND will be validated through the CHARADMexp campaign.
ACTRIS provides support to CHARADMexp participants by offering access to the Finokalia research facilities through the Transnational Access activity of the Network.